


Asana's Q3 2021 Results: Another Stellar Quarter; Monitor for Further Multiple Compression
In this short article, I discuss Asana's impressive Q3 2021 results and their current valuation.

Asana (NYSE:ASAN) is a Software as a Service (SaaS) business based in the US which helps enterprises organise, track, and manage their work projects. It is among a growing list of public companies in the project management software space, including Atlassian (NASDAQ:TEAM) and a more recent debutant to the public markets, Monday.com (NASDAQ:MNDY).
Asana went public via a direct listing in September 2020 and has been a stellar performer, rising more than 136% through to the date of this article (9th January 2022). Nonetheless, this absolute return obscures the rather volatile nature of Asana’s share price journey, with shares at one stage up more than 450% through to mid-November 2021. Since that 52-week high, shares have dropped almost 60% to the current price of $61.22.
Engaged public market investors will be well aware of the sharp multiple compression in US technology/growth stocks over the past two months, which has been more pronounced in companies that generate GAAP losses (i.e., Asana). Asana was long overdue for a correction after an almost parabolic rise in share price through the first nine months of 2021, so I’m not surprised to see shares pull back on fears of persistent inflation and tighter monetary policy. Based on Asana’s $50b+ TAM and excellent business execution since IPO, I believe the current price represents a ‘reasonable’ (but not a ‘no-brainer’) valuation for patient long-term investors with a strong stomach for price volatility.

Continued strong growth in revenue and customers
Asana reported revenue in Q3 2021 (equivalent to Q3 FY22 in the below figures) of $100.3m (+12% Q/Q; +70% Y/Y), which was (as per usual) well ahead of their internal guidance for $93-94m. 42% of this revenue was generated outside of the US.
One of the hallmarks of an exceptional software business is consistent organic Q/Q growth in revenues, driven from upsells to existing customers and sales to new customers. Asana fits this mould, reporting Q/Q revenue growth of 9-18% over the past 11 quarters (since Q1 2019) without a single quarter of Q/Q revenue declines.

Asana’s core market is large enterprise customers with complex workflow needs, which helps to differentiate them from other businesses in the enterprise software space (e.g., Monday.com) which focus on smaller enterprise customers. In Q3 2021, Asana reported 96% Y/Y revenue growth from customers spending at least $5,000 on an annualised basis, which represented 68% of total revenues (up from 66% in Q2 2021 and 59% in Q3 2020).
As shown in the below figure, Asana’s percentage of revenue attributable to customers with at least $5,000 annualised spend has trended higher for the past eight quarters, indicative of increasing product-market fit and adoption among large enterprise customers.

Asana also reported 739 enterprise clients with annualised spend of at least $50,000, representing growth of 24% Q/Q and 132% Y/Y. The rate of customer growth among these largest enterprise clients has accelerated in the past three quarters from 92% to 132% Y/Y growth, which is a remarkable result and a testament to the value that Asana’s software provides to large/complex enterprises.

World-class net dollar retention rates
Asana reported improvements in net dollar retention rates across all cohorts in their Q3 results. It is important to note that Asana reports net dollar retention rates on a last 12 month (LTM) basis, so large improvements from one quarter to the next are somewhat obscured as rates are averaged across the previous four quarters.
Asana’s Q3 net dollar retention rates are reported below, with the standout figure being their > 145% net dollar retention rate among customers with at least $50,000 annualised spend. If we compare these Q3 2021 results to those reported in Q3 2020, we see consistent 500 basis point improvements across all cohorts: (1) overall (> 115%), (2) customers with > $5,000 annualised spend (> 125%), and (3) customers with > $50,000 annualised spend (> 140%).

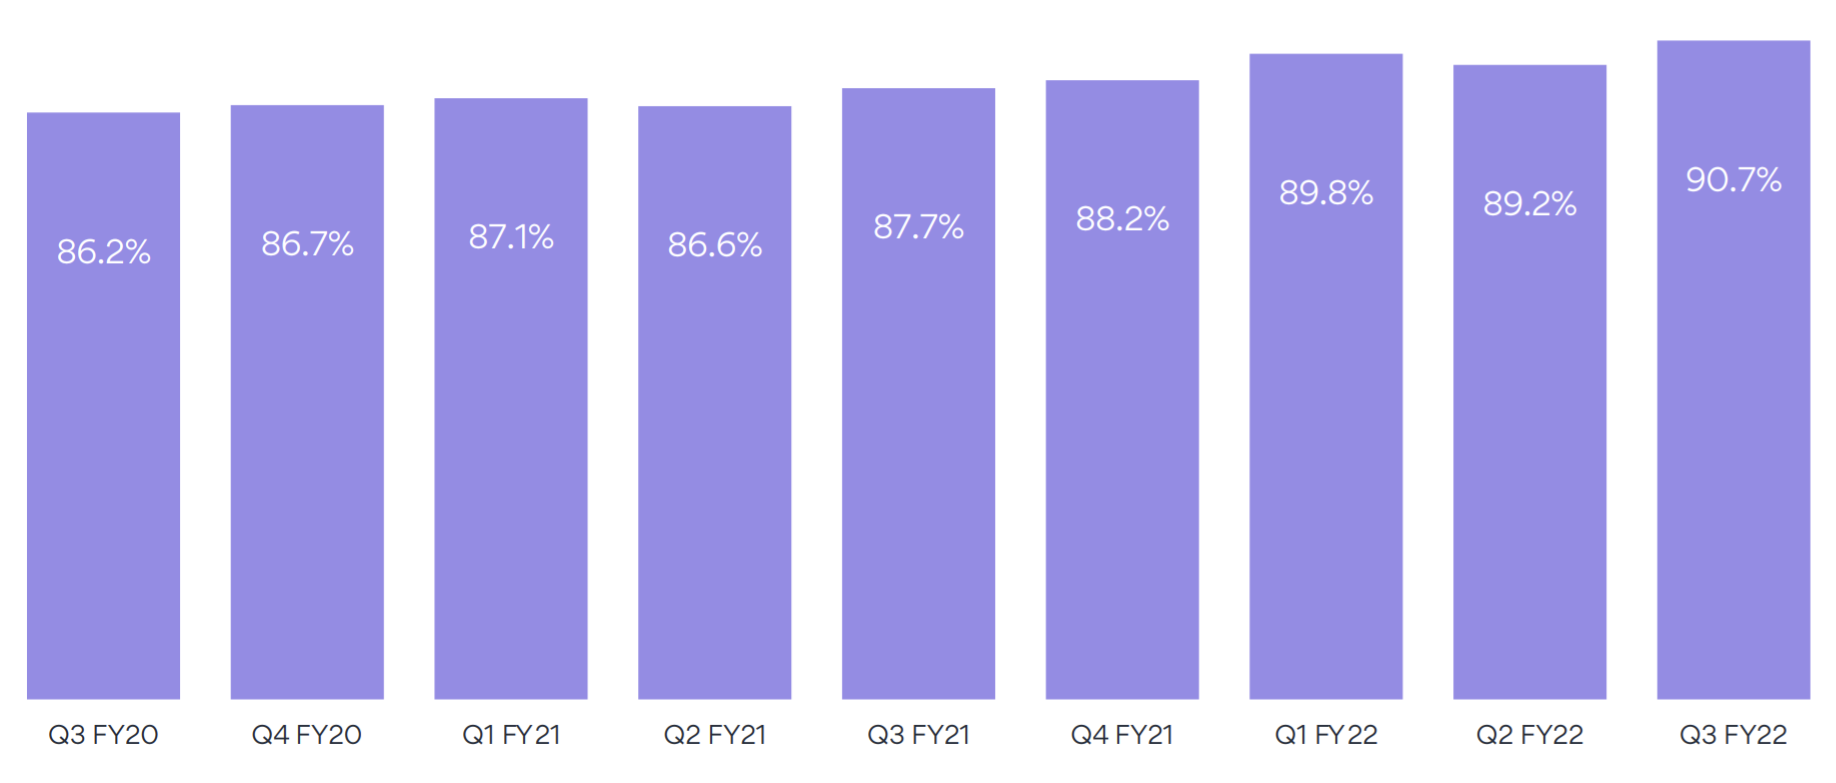
Continued expansion in gross margins
Asana reported a non-GAAP gross margin (excludes share-based compensation) of 90.7% in Q3 2021, which was up from 89.2% in Q2 2021 and 87.7% in Q3 2020. GAAP gross margin in Q3 2021 was 90.5%, which is a negligible difference to the above reported non-GAAP figure.
As is shown in the below figure, Asana’s gross margins have trended higher over the past eight quarters and are world-class in the enterprise software space, rivalling the likes of Adobe (NASDAQ:ADBE) and GitLab (NASDAQ:GTLB). Having a gross margin in the 90% range indicates (1) Asana’s pricing power and (2) Asana’s potential to generate significant operating leverage at scale.
Widening GAAP losses have some investors worried
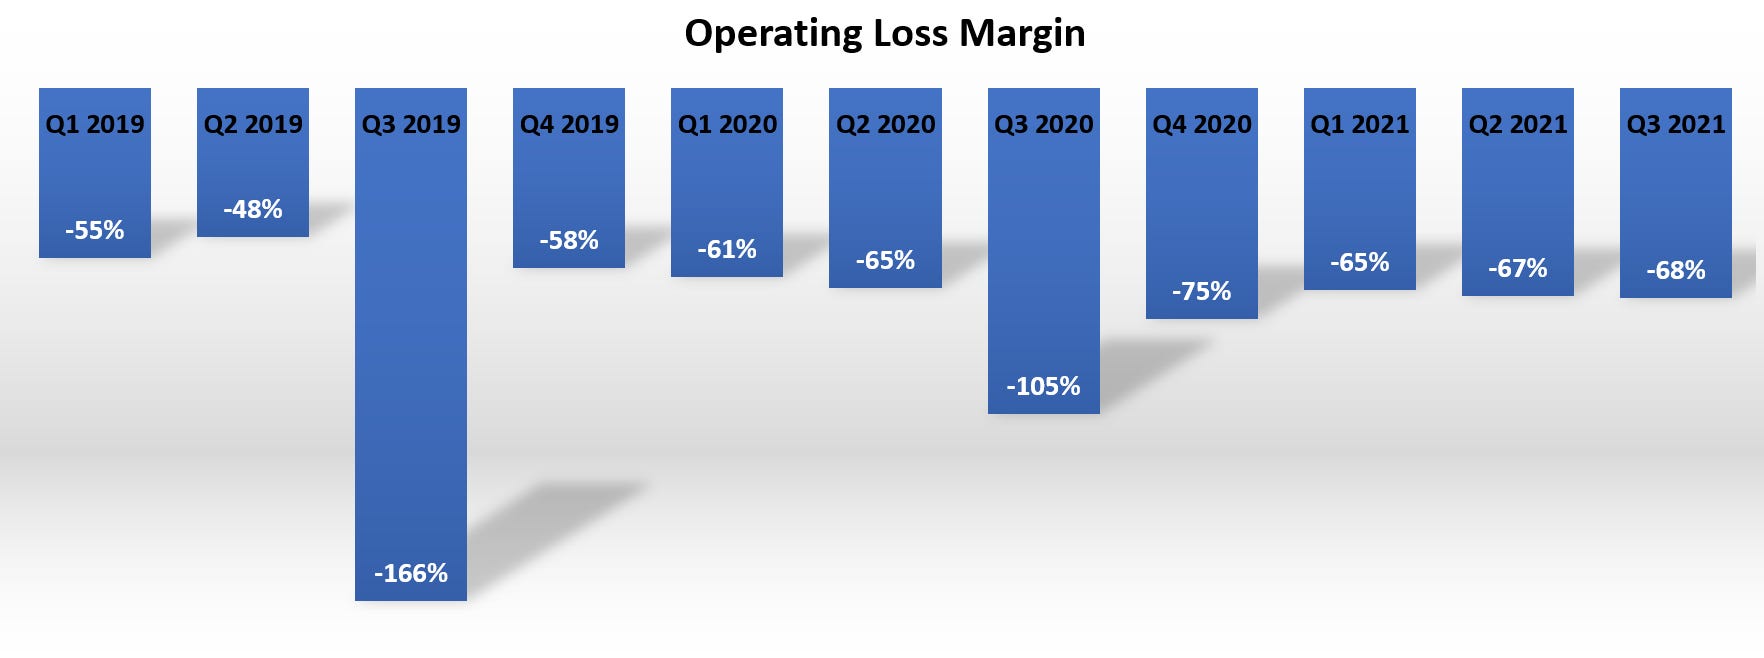
As has become the norm with US mid-cap growth companies, Asana is not profitable. Current operating margins are horrific and have fluctuated between -48% to -166% from Q1 2019 to Q3 2021 with a simple weighted average of -76%. Thus, while top-line growth in revenues and customers is impressive, Asana is producing enormous net losses to achieve these growth numbers.
One of the core skillsets of a successful growth investor is being able to differentiate between a business that is:
Structurally unprofitable (i.e., has no path to profitability and is forever dependent on the capital markets); or
Has a path to profitability and is de-emphasising short-term profitability to create the foundations for long-term value creation (the classic/overused example that comes to mind here is Amazon).
There is no doubt that Asana has impressive revenue growth and an envious gross margin profile. However, the critical question dividing Asana bulls and bears is whether Asana falls into the (1) or (2) camp.
Sales and marketing accounts for most of Asana’s operating expenses, representing 73% of revenues in Q3 2021, but down from 82% in Q3 2020 (note: these are all GAAP figures). Research and development is another large expense (or investment depending on your perspective), representing 54% of revenues in Q3 2021, again down from 56% in Q3 2020. Thus, Asana is making significant investments into:
Research and development to ensure their software offering continues to meet the needs of large/complex enterprises and is equivalent/superior to competitors; and
Sales and marketing to increase brand recognition and build out their enterprise salesforce.
Given the high switching costs for a large enterprise client once Asana becomes the central hub for organisational workflows and the fragmented nature of the project management software space (i.e., lots of competitors with no monopolistic leader), it makes sense for Asana to continue to invest heavily to improve their competitive position. Moreover, Asana’s high net dollar retention rates suggest that a large enterprise customer signed during a given quarter should generate multiples of that customer acquisition cost if Asana is able to retain them as a client over the medium-term. Unfortunately, Asana does not provide data on unit economics, so we do not have specific figures for customer lifetime value (LTV) or customer acquisition cost (CAC), which makes this section more speculatory than I would like.
Guidance for widening losses in Q4 2021 spooked investors
In Q4 2021, Asana expects revenues of $104.5-105.5m, representing 4-5% Q/Q growth and 53-54% Y/Y growth. Given Asana’s demonstrated track record of beating their internal revenue guidance each quarter since IPO, I expect Q4 revenue to come in somewhere around the $108m mark (+8% Q/Q; +58% Y/Y). Asana also upgraded FY22 revenue guidance (spanning Jan 2021 to Jan 2022) from $357-359m to $371-372m.
Despite solid revenue guidance, Asana forecasted widening operating losses in Q4 2021, which I believe accounts for the brutal 26% sell-off in Asana shares during the trading session following their Q3 results. I expect Asana to continue to incur significant operating losses over the coming quarters as part of their investments in research and development, and sales and marketing for the aforementioned reasons.
An excellent corporate culture with notable inside ownership
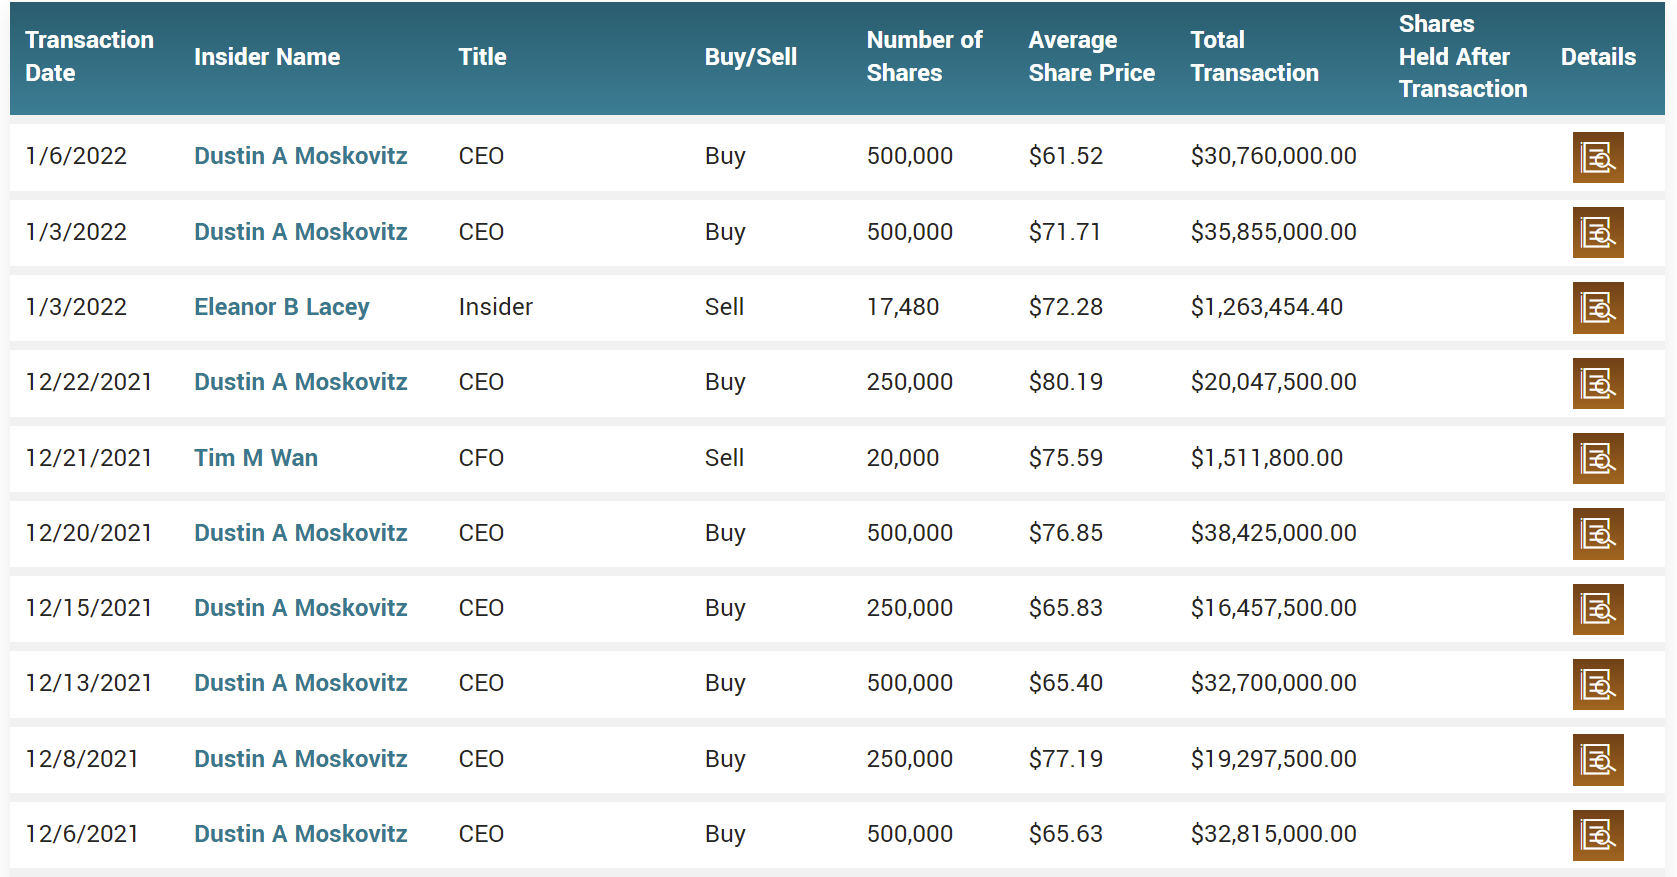
One of the first things that attracted me to Asana was their incredible reviews on Glassdoor and high inside ownership. CEO Dustin Moskovitz has a 100% approval rating on Glassdoor and Asana is frequently rated as one of the best places to work in the US, particularly for women and minority groups (see here and here). Dustin Moskovitz owns around 8.4% of outstanding shares, valued at around $950m, and has been aggressively adding to his shareholding over the past six months (see below), which is a pleasing sign for investors.
Some thoughts on valuation
As of 9th January 2022, Asana has a market cap of $11.3b, with $343.4m in cash and short-term investments, and total debt of $38.9m, resulting in a net cash position of $304.5m. Asana’s current EV/LTM sales multiple is 33x with a forward EV/sales multiple of 22x based on analyst revenue growth estimates for the next four quarters. Keep in mind gross margins in Q3 2021 were 91%.
As is seen in the below figure, Asana has experienced > 60% multiple compression since mid-November 2021. While not a bargain/no-brainer valuation, I believe Asana’s current valuation is still reasonable given (1) the stickiness of their revenue base (manifesting in high net dollar retention rates), (2) their very high gross margins, and (3) recent insider purchases from Dustin Moskovitz.
Based on Asana’s accelerating top-line metrics and their demonstrated track-record of exceeding internal/analyst forecasts, I would not be surprised to see Asana report > 50% Y/Y growth in 2022. Assuming 50% growth over the next four quarters, Asana trades on a forward EV/sales multiple of around 20x, which is closer to their historical trading range throughout the first six months of 2021.

Below I have compared Asana with their two major competitors, Atlassian and Monday.com. What stands out to me here is: (1) all three businesses have similar gross margins, with Asana leading the pack; (2) both Asana and Monday.com are heavily unprofitable based on GAAP EBIT margins; and (3) all three businesses trade at comparable valuation multiples, despite noticeable differences in trailing and forecasted growth rates. At first glance, the high-level metrics and valuation appears to be slightly superior for Monday.com, but I do not know enough about the business to make a judgement on the durability of their revenue growth and competitive positioning. However, I plan to take a more detailed look at Monday.com in the coming months.

Conclusion
This was a classic ‘beat and raise’ quarter from Asana with 70% Y/Y revenue growth and 132% Y/Y growth in the number of enterprise customers with annualised spend in excess of $50,000. Expanding gross margins to the 90% range and improving net dollar retention rates across all cohorts also paint a picture of a thriving business.
Understandably, investors seem to be concerned with Asana’s widening GAAP losses in the face of increasing competition in the project management software space. It seems that every other week I hear a new project management software business advertising on one of the finance/business podcasts I listen to, so the threat of competition is genuine. Nonetheless, I believe the industry will eventually consolidate into an oligopoly structure, led by a handful of businesses with strong brand recognition, cash-rich balance sheets, and access to external capital to accelerate investments in product innovation, and sales and marketing. Given that the project management software space is a $50b+ market (and growing), I see room for multiple winners in the space.
After the sharp contraction in multiple since mid-November 2021, I rate Asana as a buy for long-term investors willing to stomach the price volatility that goes hand in hand with investing in growth companies. However, I would not be surprised to see further price weakness due to external macroeconomic factors in the coming months, so there ‘could’ be more attractive opportunities down the line. I am not a market timer, so I plan to continue to add to my Asana position (initial cost basis of $30.90) in small increments over the next 3-6 months.
Best,
Jordan